One of the important thing to monitor on the PostgreSQL is the streaming replication, it is very important to know the latency between the pg master and pg slave so we can make sure that our database are consistent
There’s a PostgreSQL functions to check the the WAL current status. for the master “pg_current_xlog_location()” and for slave “pg_last_xlog_replay_location()” this can provide the result of the current byte position (e.g. 0/D02E9A0 ) but not on a numerical value that is why we need to implement a script to convert the current byte position into integer and send the value to monitoring services like Stackdriver
Statsd
A network daemon runs on Node.js platform and listen for statistics, it send data on a backend service like Graphite over UDP or TCP. to learn more about Statsd kindly visit this Link
Set-up Statsd to send aggregated metrics on Stackdriver
Need to install the dependency for statsd (nodejs and npm)
$ sudo yum install nodejs npmDownload the statsd and the stackdriver-stackd-backend then define the api-key of your stackdriver account of your statsd configuration
$ git clone https://github.com/etsy/statsd
$ cd statsd
$ npm install stackdriver-statsd-backend
Create a stackdriver statsd config
example:

sdriverconifg.js
{
    flushInterval: 60000,
    backends: [ "stackdriver-statsd-backend" ],
    stackdriver: {
    apiKey: "APIKEYVALUEHERE"
    }
}
To run statsd
$ cd statsd
$ bin/statsd sdriverconfig.js
16 Sep 12:10:44 - reading config file: sdriverconfig.js
16 Sep 12:10:44 - server is up
Script to monitor the Write Ahead Log on Master
wal_master.py
#!/usr/local/bin/python2.7
import socket
import sys
import time
import re
import os
from statsd import StatsdClient
from subprocess import Popen, PIPE
import subprocess
masterip = sys.argv[1]
mqry = 'select * from pg_current_xlog_location();'


c = StatsdClient('localhost', 8125)

#define methods that will remove "/" on the value
def rem(wal):
  return re.sub("/", "", wal)
#remove extra line #print mwal.rstrip('\n')
try:
  while True:
    # get the wal status on master
    mwal = subprocess.check_output(['psql', '-q', '-t', '-A', '-w', '-c', mqry ])
    #then convert to integer as a "bytes" value
    mas = rem(mwal)
    master = int(mas, 16)
    c.incr('wal_master_status', master)
    print master
    time.sleep(7)
except KeyboardInterrupt:
  print "Exit Status"
Script to monitor the Write Ahead Log status on slave
wal_slave.py
#!/usr/local/bin/python2.7
import socket
import sys
import time
import re
import os
from statsd import StatsdClient
from subprocess import Popen, PIPE
import subprocess


sqry = 'select * from pg_last_xlog_replay_location();'
#define databse
db = 'databasename'


c = StatsdClient('localhost', 8125)
#define methods that will remove "/" on the value
def rem(wal):
  return re.sub("/", "", wal)


#remove extra line #print mwal.rstrip('\n')
try:
  while True:
    # get the wal status on master and slave
    swal = subprocess.check_output(['psql', '-q', '-t', '-A', '-w', '-c', sqry ])
    #then convert to integer as a "bytes" value
    sla = rem(swal)
    slave = int(sla, 16)
    #lagval = master - slave
    c.incr('wal_slave_status', slave)
    print slave
    time.sleep(7)
except KeyboardInterrupt:
  print "Exit Status"
You can checkout the python script for both master and slave here
Note:
Script dependencies
- Python version 2.7
- python-statsd
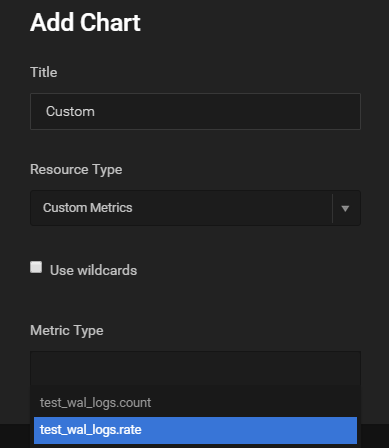
This will send the extracted data to Stackdriver and it will automatically populate the “wal_master_status” and the “wal_slave_status” on metric type option once adding a chart for your own dashboard
For more details about sending custom metrics on Stackdriver kindly check here
